type
Post
status
Published
date
Nov 10, 2021
slug
data_analysis_ncwu
summary
一、概述
(1)数据描述
数据来源:本项目数据全部来自华北水利水电大学官网通知页,链接:https://www5.ncwu.edu.cn/channels/5.html
数据获取:日期,发文部门,标题,内容,通知链接等,并将这些数据存储为CSV格式并转存到数据库中。
(2)整体步骤
第一步:从网页上获取HTML内容
第二步:分析网页内容并提取需要的信息
第三步:将获取到的信息整理并保存
第四步:将数据统计,分析
tags
爬虫
数据分析
category
数据分析
icon
password
Property
Nov 16, 2022 09:10 AM
一、概述
(1)数据描述
数据来源:本项目数据全部来自华北水利水电大学官网通知页,链接:https://www5.ncwu.edu.cn/channels/5.html
数据获取:日期,发文部门,标题,内容,通知链接等,并将这些数据存储为CSV格式并转存到数据库中。
(2)整体步骤
- 第一步:从网页上获取HTML内容
- 第二步:分析网页内容并提取需要的信息
- 第三步:将获取到的信息整理并保存
- 第四步:将数据统计,分析
- 第五步:绘制统计图、词云等可视化操作
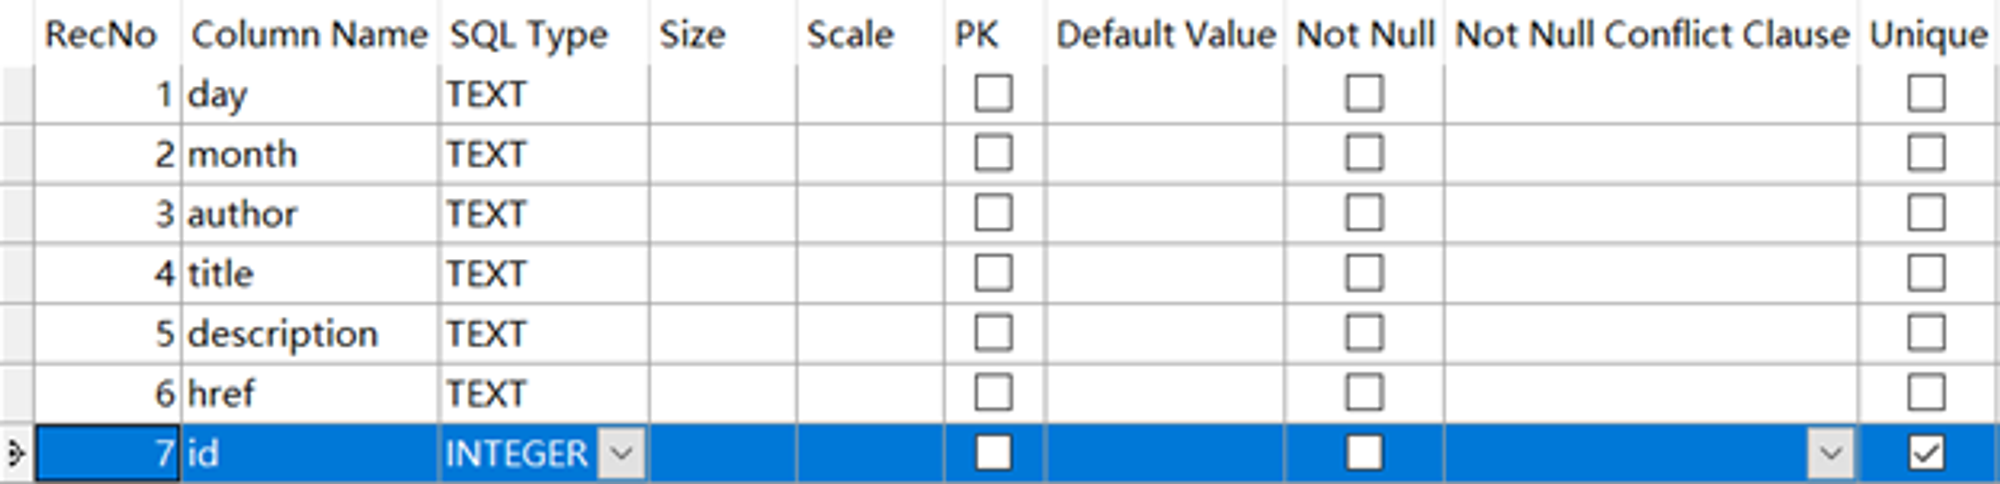
二、数据存储
数据库设计如下,存储字段为day、month、author、title、description、href、id,分别对应日,年月,发文部门,标题,内容,通知链接。
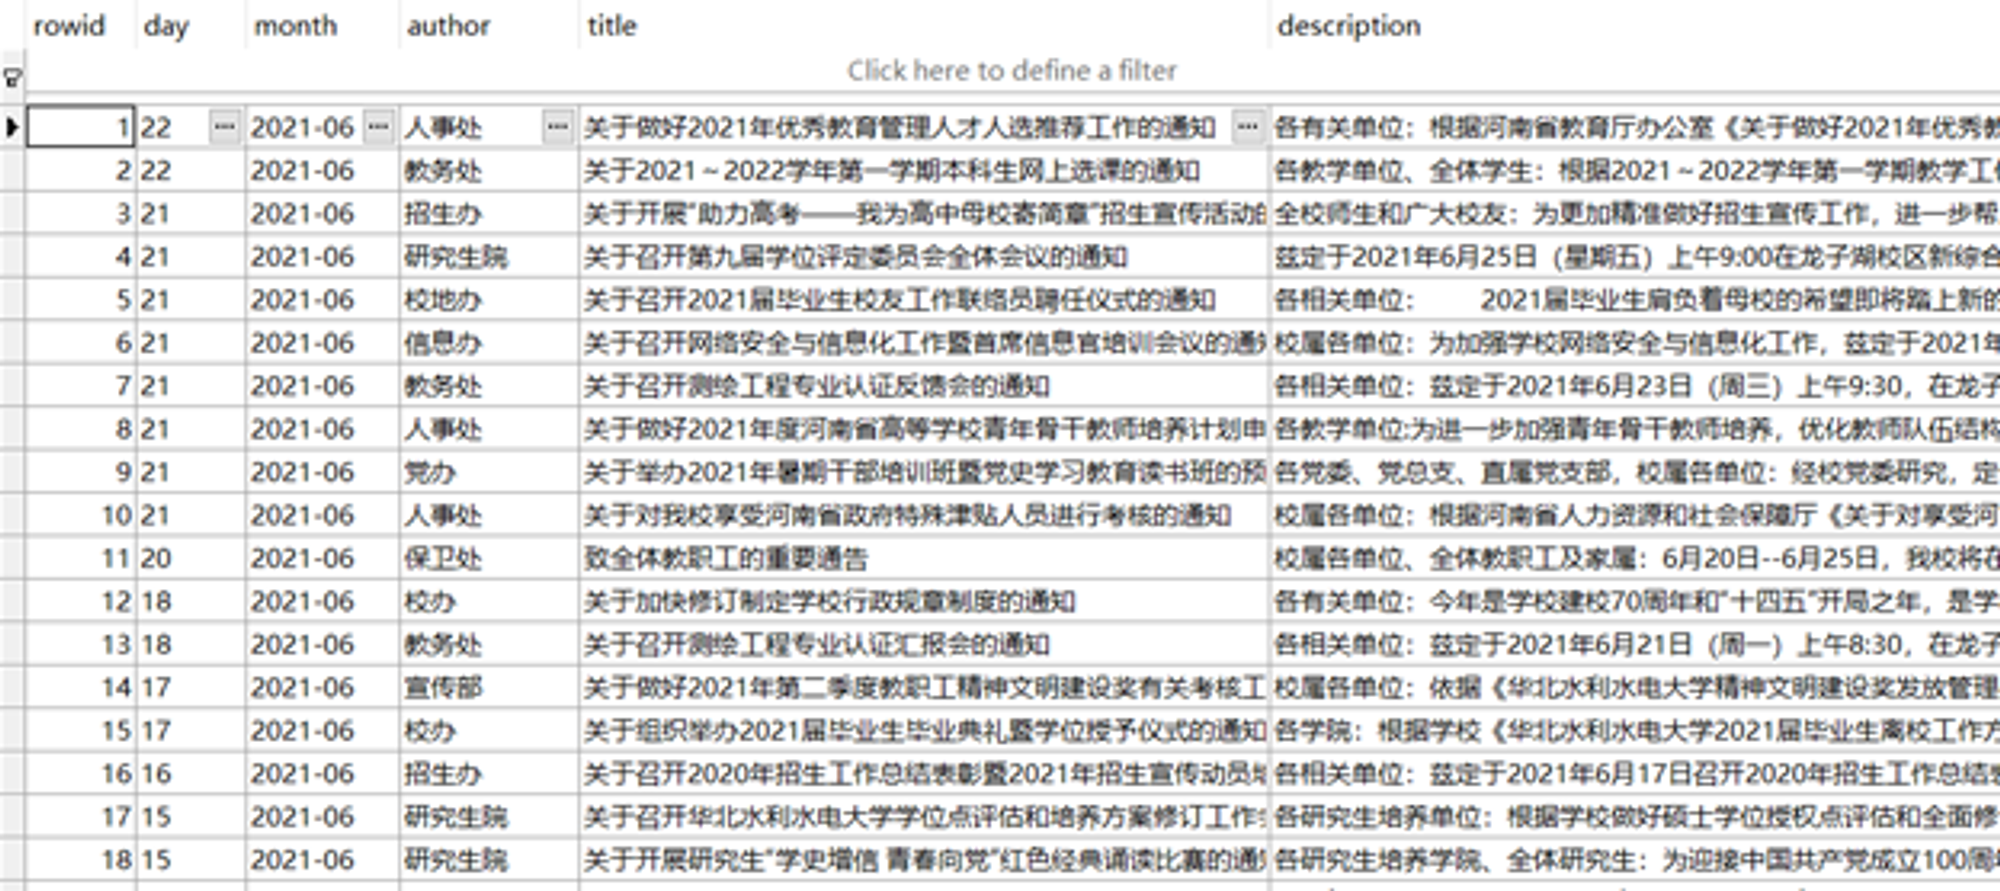
数据存储效果如下:
三、系统实现
(1)数据获取与解析
response = requests.get('<https://www5.ncwu.edu.cn/channels/5.html>')
response.encoding='utf-8'
通过requests库的get方法请求url,并将编码格式设为utf-8。
soup = BeautifulSoup(response.text,"html.parser", fromEncoding='utf-8')
days = soup.select('div.news-item > div.date > div.day ')
months = soup.select('div.news-item > div.date > div.month ')
authors = soup.select('div.news-item > div.description > h2 > a.dw ')
titles = soup.select('div.news-item > div.description > h2 > a ')
通过BeautifulSoup库可以方便解析html文本结构,这里提取出了所有的日期、发文部门、标题。
(2)数据处理与可视化分析
plt.rcParams['font.sans-serif'] = ['simhei']  # 用来正常显示中文标签
plt.rcParams['axes.unicode_minus'] = False  # 用来正常显示负号
设置matplotlib中文格式,避免出现乱码
data = data.dropna()
清除缺失值
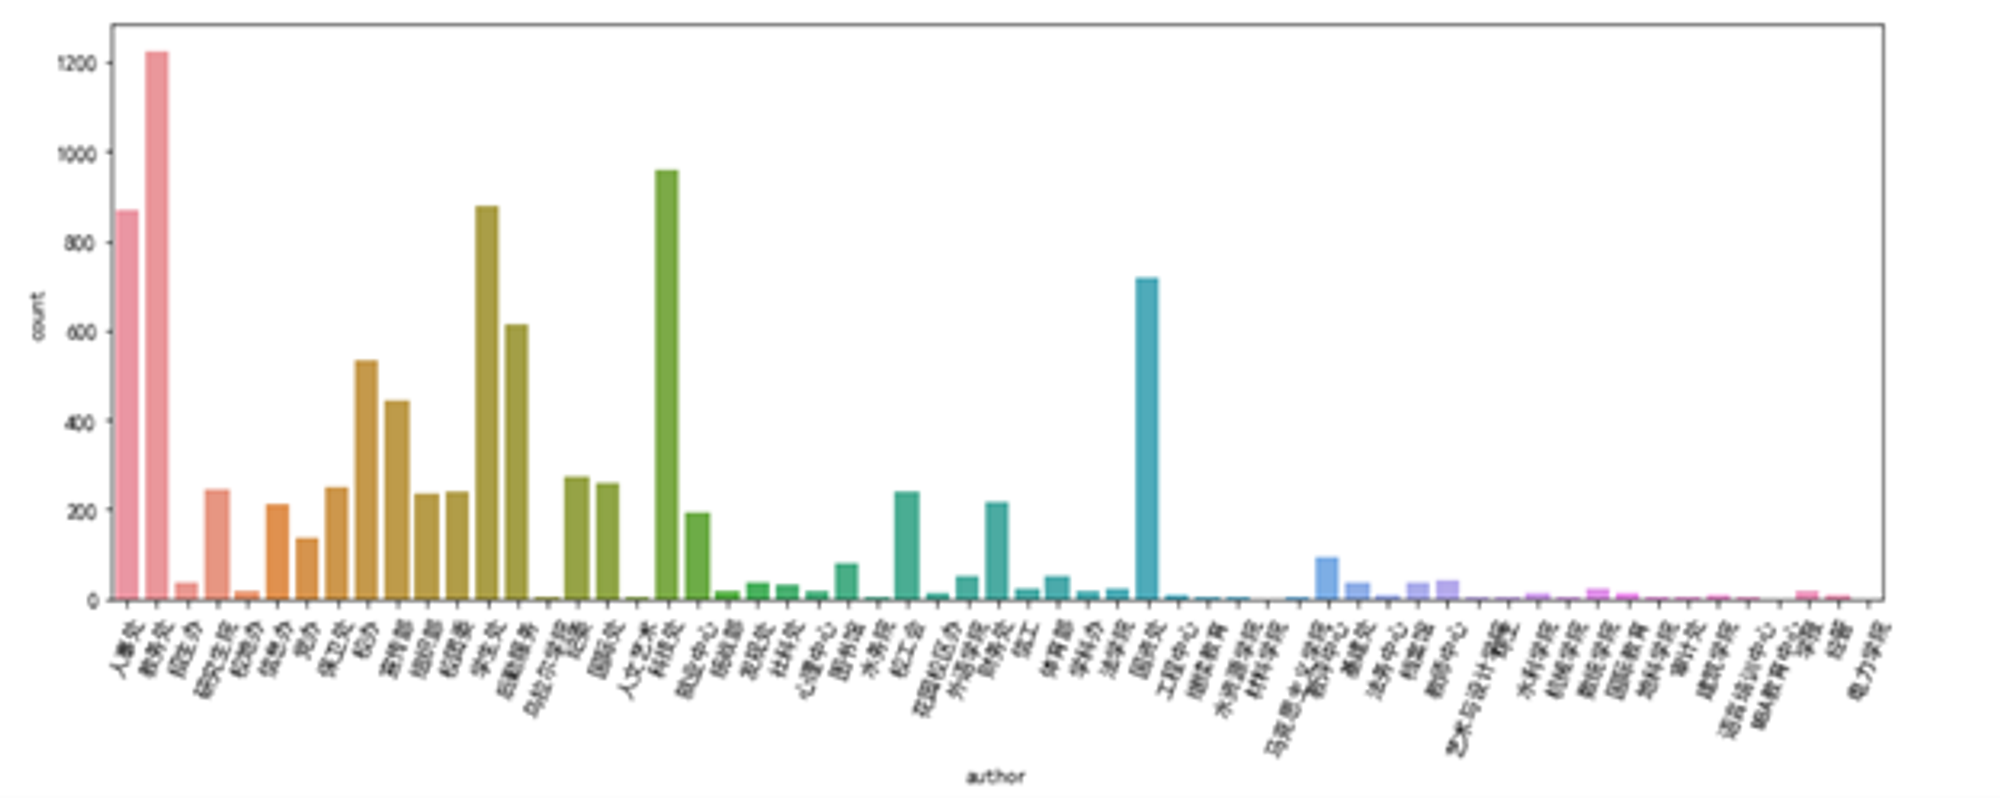
plt.figure(figsize=(15,5))
plt.xticks(rotation=70)
sns.countplot(data['author'])
plt.show()
统计各个发文部门的发文数量,并绘制柱状图。
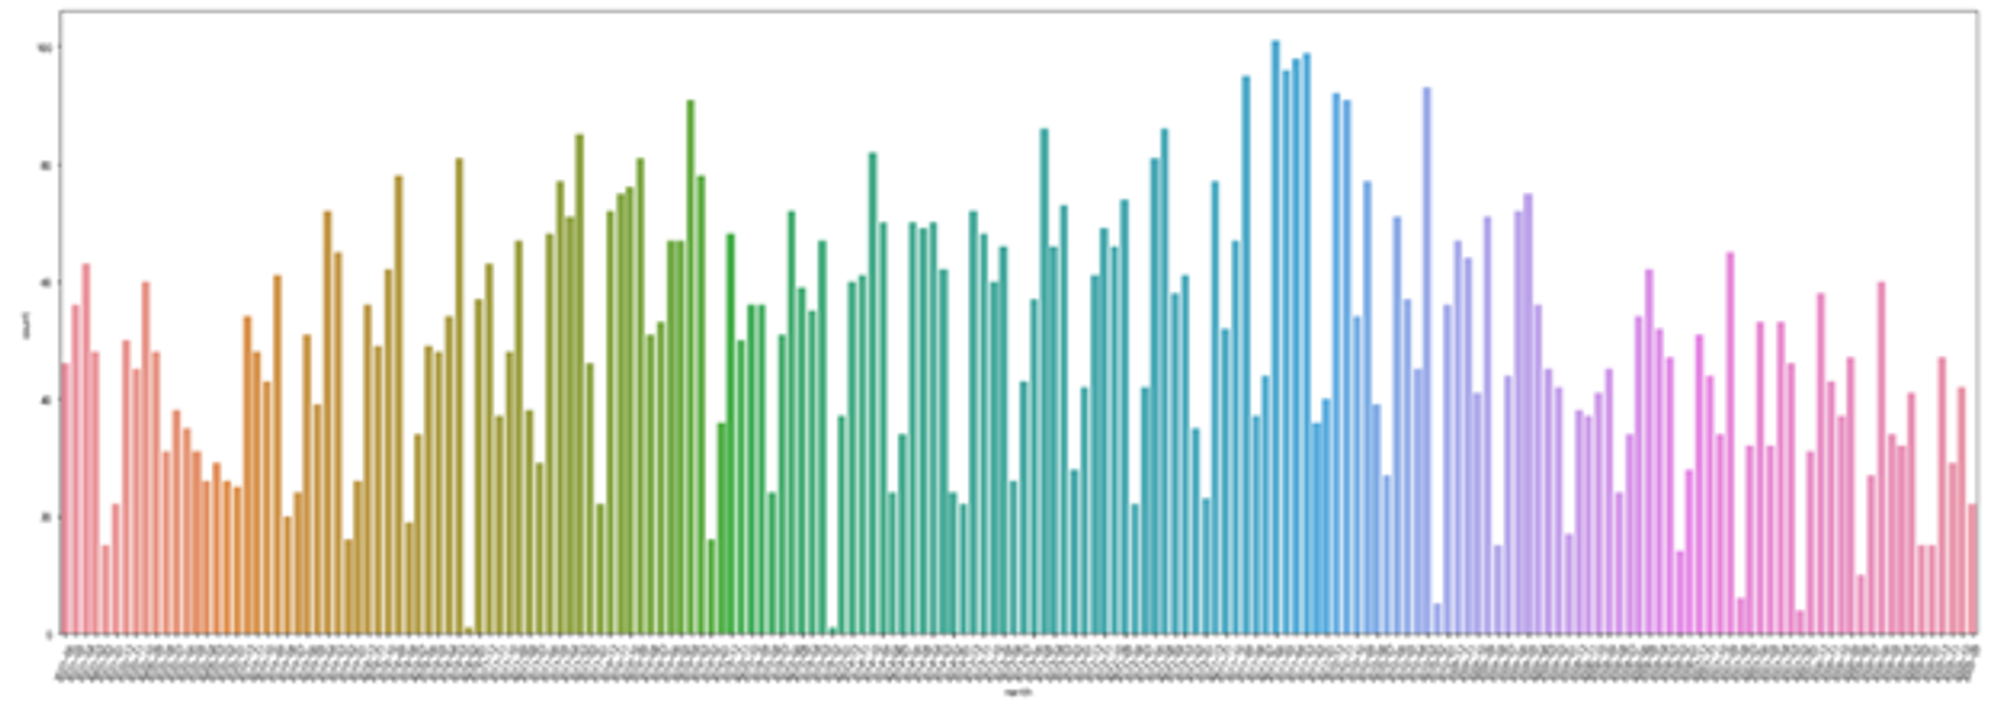
plt.figure(figsize=(30,10))
plt.xticks(rotation=70)
sns.countplot(data.sort_values('month',ascending=False)['month'])
plt.show()
统计从2005年到2021年每月的发文数量,并绘制柱状图。
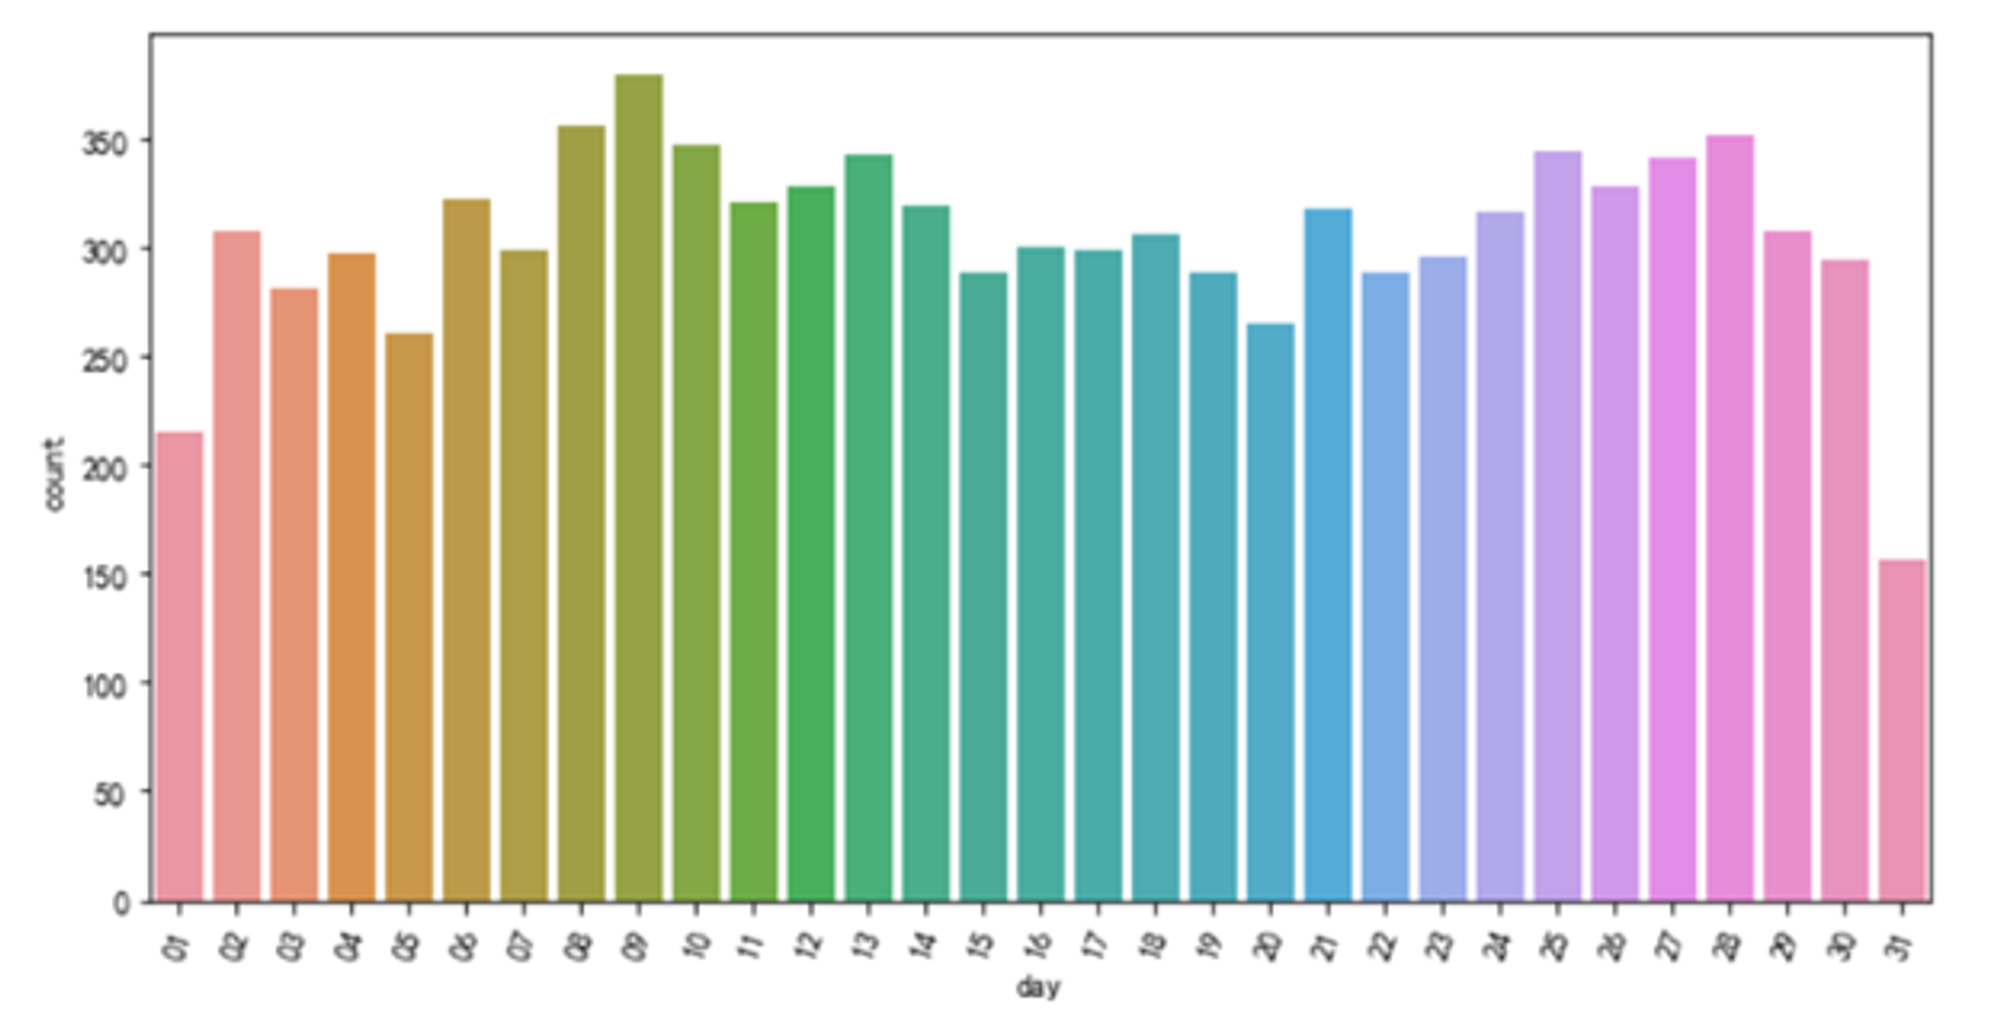
plt.figure(figsize=(10,5))
plt.xticks(rotation=70)
sns.countplot(data.sort_values('day',ascending=True)['day'])
plt.show()
统计每月各天内发文数量,并绘制柱状图。
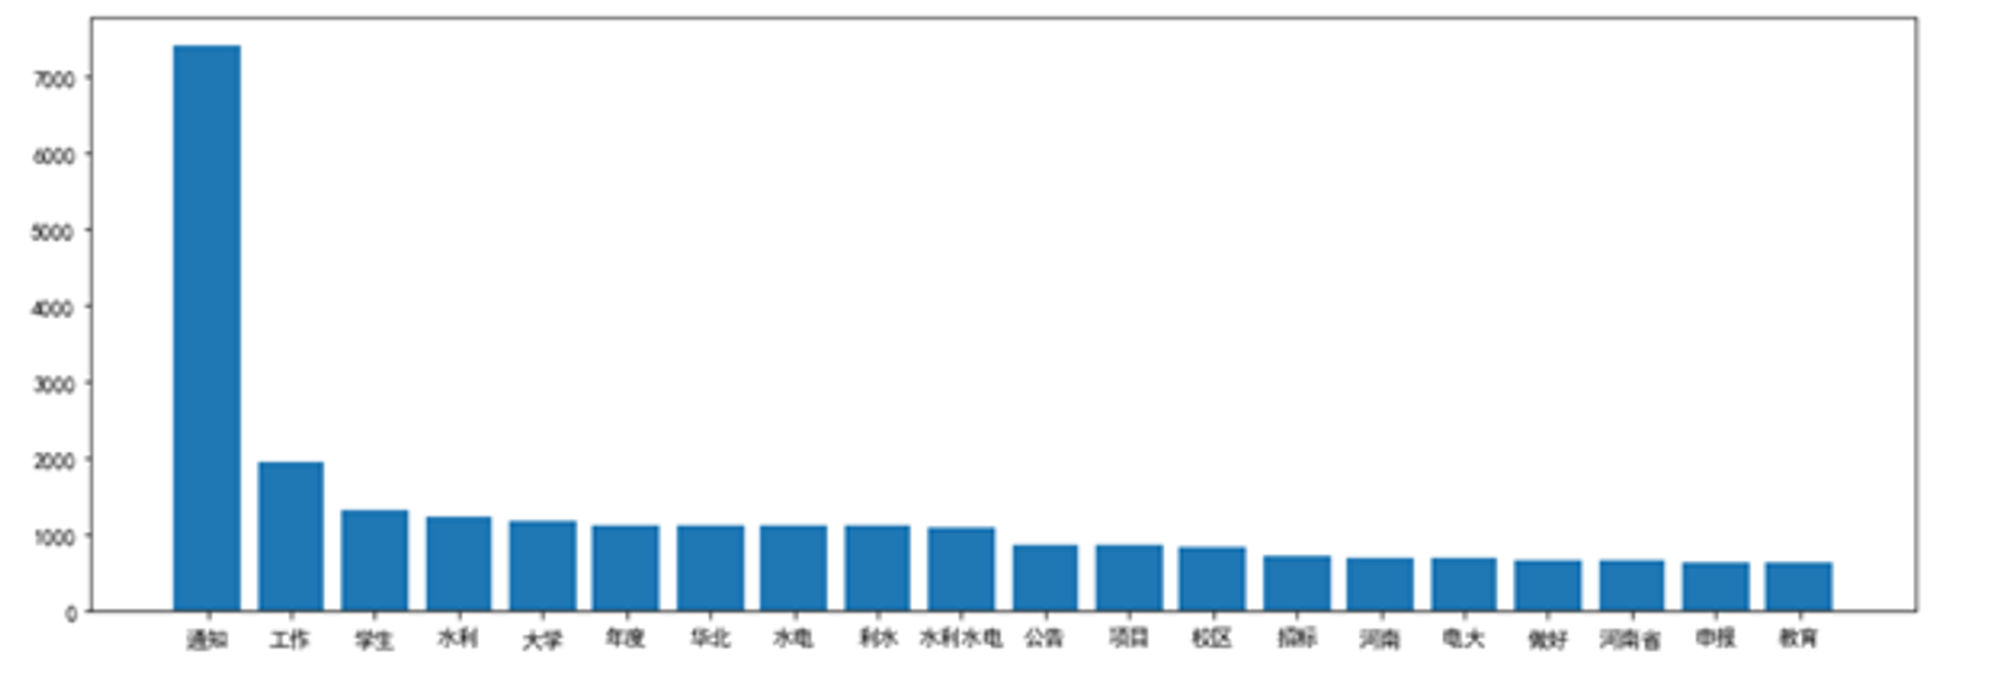
words = jieba.cut(''.join(df_a1),cut_all=True)
words = movestopwords(words)
word_hot={}
for i in words:
    if len(str(i))>1:
        word_hot[i] = word_hot.get(i,0)+1
word_hot = sorted(word_hot.items(),  key=lambda d: d[1], reverse=True)[:20]
word_hot = [[i[0] for i in word_hot],[i[1] for i in word_hot]]
plt.figure(figsize=(15,5))
plt.bar(word_hot[0],word_hot[1])
plt.show()
plt.savefig('./wordhot_ncwu.png') # 保存图像
统计所有标题的重点词汇,统计词频并绘制前20的柱状图
wc = WordCloud(
    font_path='simhei.ttf',     #字体路劲
    background_color='white',   #背景颜色
    width=1000,
    height=600,
    max_font_size=300,            #字体大小
    min_font_size=10,
    max_words=100,
    collocations=False,
    font_step=1
)
s=wc.generate(' '.join(words))
plt.figure(figsize=(10,6))
plt.imshow(s)
plt.axis('off')
plt.show()
s.to_file(r'wordcloud_ncwu.png')
通过词频统计,绘制词云图

- Author:Quanfita
- URL:https://quanfita.cn/article/data_analysis_ncwu
- Copyright:All articles in this blog, except for special statements, adopt BY-NC-SA agreement. Please indicate the source!
Relate Posts